|
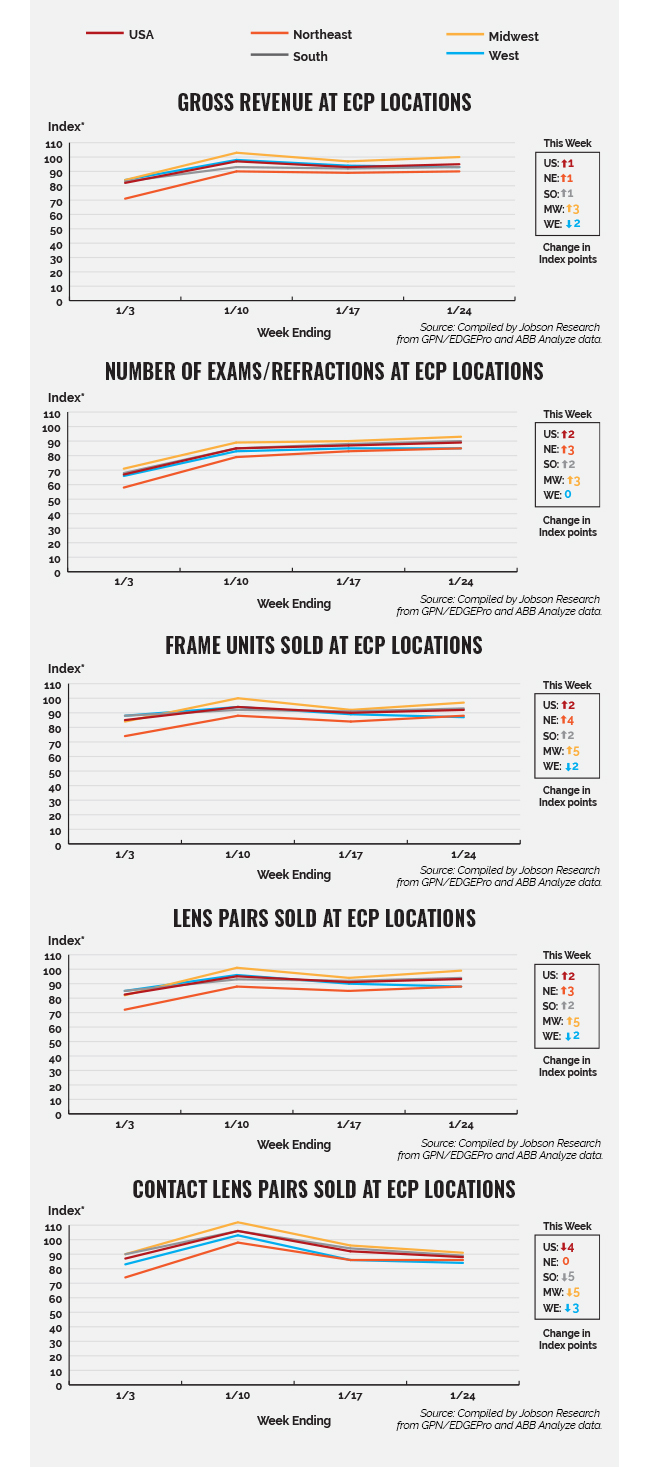
Regionally, optical sales increased the most in the Midwest and decreased the most in the West. Lens pairs and frame units experienced the largest increases in optical sales in the Midwest (5 index points) followed by exams/refractions and gross revenue (3 index points). The Northeast and South also saw optical sales increase, ranging from 1 index point for gross revenue in both the Northeast and South to 4 index points for frame units in the Northeast. Optical sales in the West were flat for exams/refractions and down -2 index points for gross revenue, frame units, and lens pairs. As always, contact lenses followed their own direction, ranging from flat in the Northeast to -5 index points in the Midwest and South.
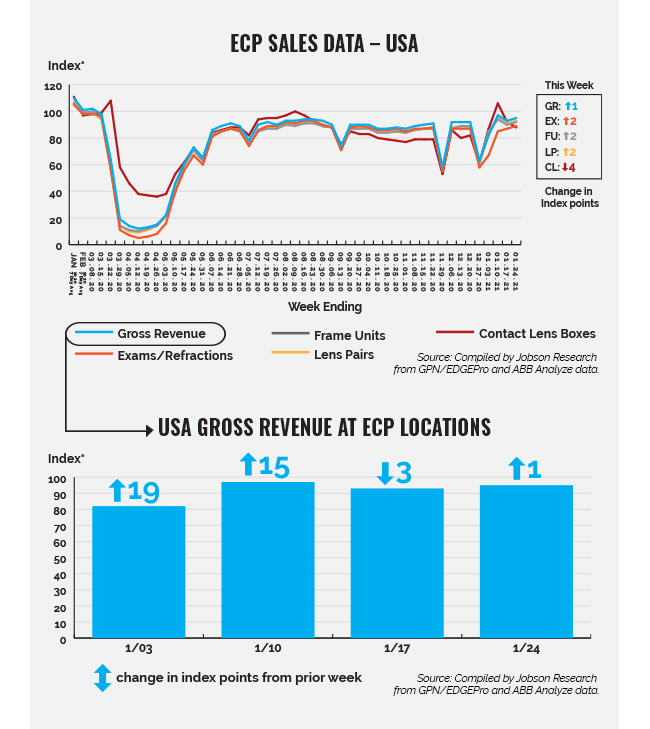
*The index baseline was developed by Jobson Research from total sales from an average seven days in the first quarter of 2019.This index baseline is equivalent to a score of 100. All other time periods going forward are calculated as a percent increase or decrease from the 100 baseline index of that period. This index is intended to show directional and magnitudinal change that the market is experiencing. Actual index scores are arbitrary meaning the baseline of 100 is simply used as a benchmark. Jobson Research shall not be held liable for any use or misuse of the data described and/or contained herein.
Please note that practices that use practice analytic systems tend to skew a bit larger and have higher revenue than practices that do not.
Source: GPN/EDGEPro and ABB Analyze contributed anonymous sales data used to determine gross revenue, exams/refractions, frame units, lens pairs, and contact lens boxes. Data was collected from approximately 3,500 independent eye care practices.
|