|
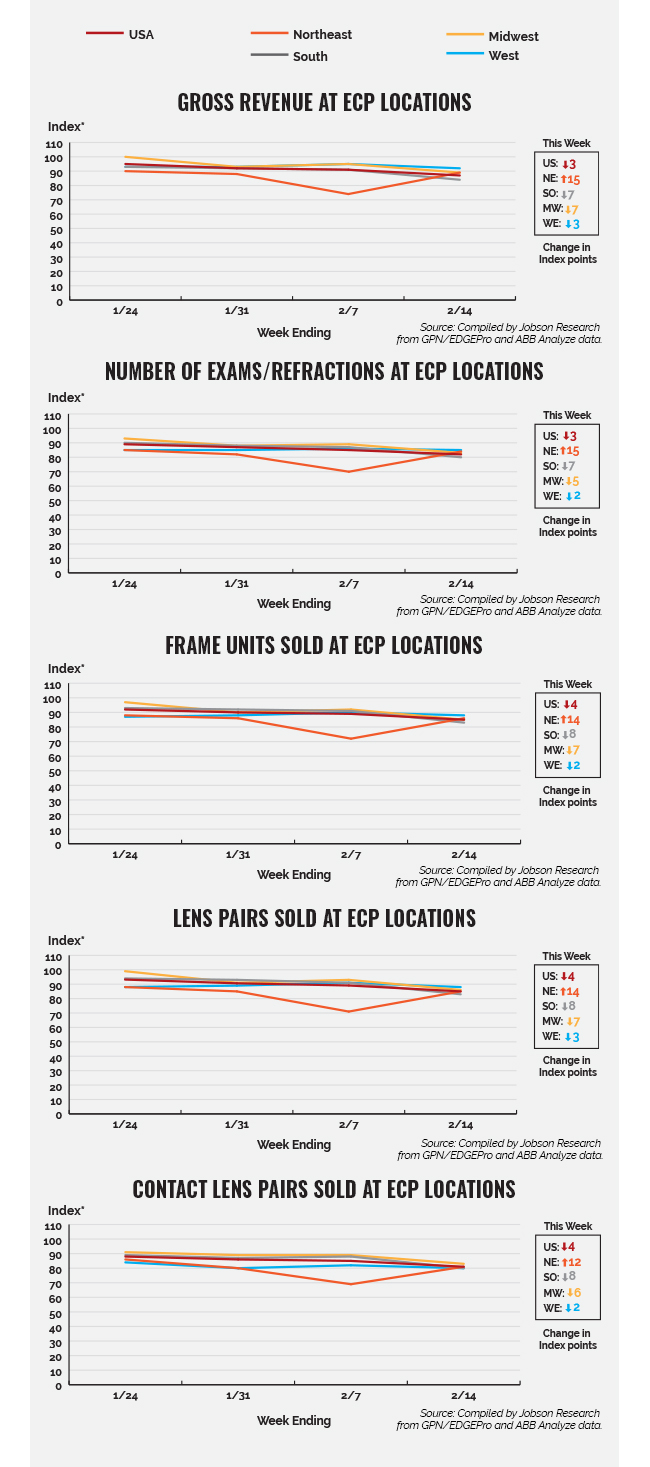
With robust optical sales over the course of last week (2/8-2/14), the Northeast regained the ground lost the previous week, while optical sales in other regions of the country decreased at smaller levels this past week, all most likely due to weather rather than declining cases of coronavirus. Optical sales in the Northeast increased last week at rates ranging from 12 index points (for contact lenses) to 15 index points (for gross revenue and exams/refractions), likely due to pent-up demand from the previous week when a major snowstorm kept consumers off the streets for a couple of days. Alternatively, the Midwest and South experienced declines last week (ranging from -5 index points for exams/refractions in the Midwest to -7 index points for gross revenue in the Midwest and in the South along with exams/refractions in the South), likely due to unusually cold and icy conditions in these regions. The West declined to a smaller extent at rates of either -2 index points (exams/refractions, frame units, contact lenses) or -3 index points (gross revenue, lens pairs).
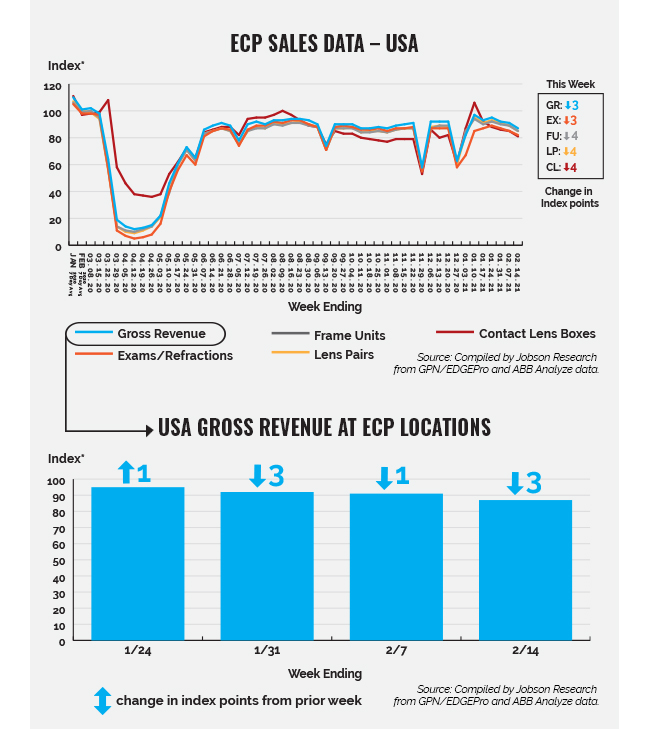
*The index baseline was developed by Jobson Research from total sales from an average seven days in the first quarter of 2019.This index baseline is equivalent to a score of 100. All other time periods going forward are calculated as a percent increase or decrease from the 100 baseline index of that period. This index is intended to show directional and magnitudinal change that the market is experiencing. Actual index scores are arbitrary meaning the baseline of 100 is simply used as a benchmark. Jobson Research shall not be held liable for any use or misuse of the data described and/or contained herein.
Please note that practices that use practice analytic systems tend to skew a bit larger and have higher revenue than practices that do not.
Source: GPN/EDGEPro and ABB Analyze contributed anonymous sales data used to determine gross revenue, exams/refractions, frame units, lens pairs, and contact lens boxes. Data was collected from approximately 3,500 independent eye care practices.
|