|
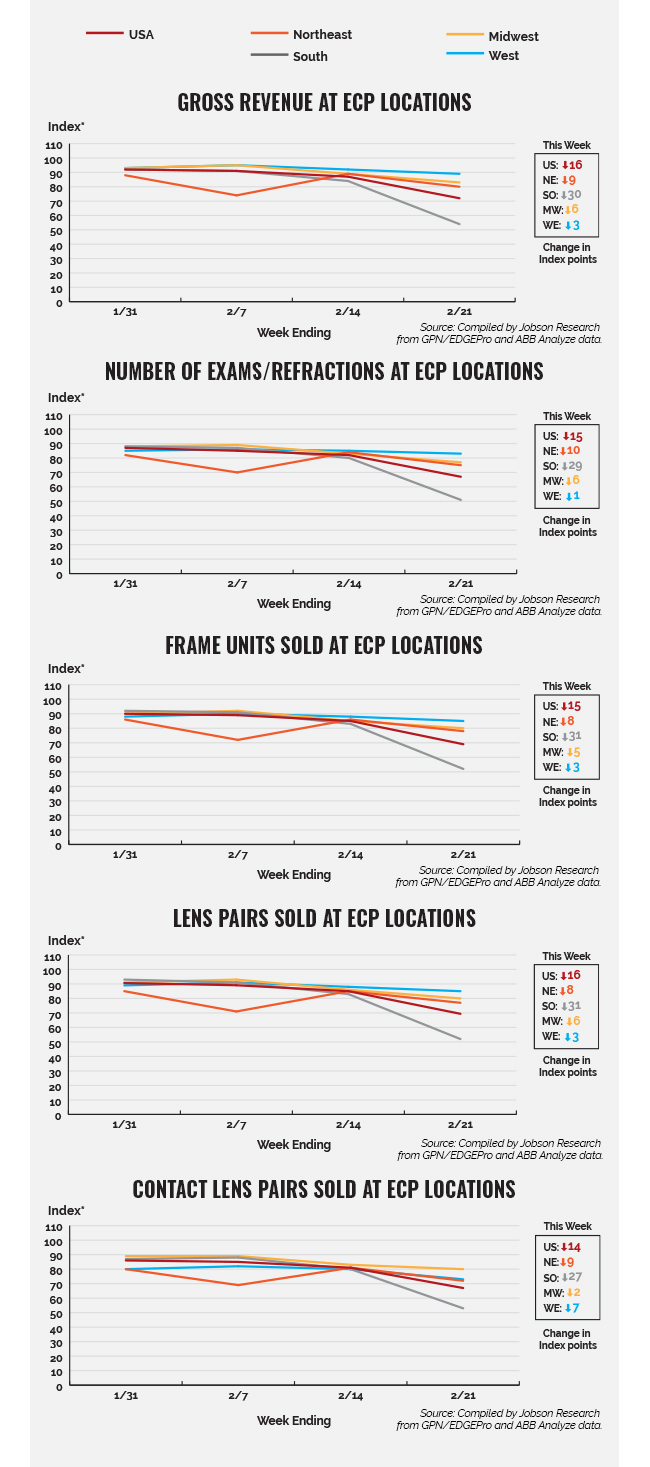
The South was crippled by extreme cold, ice, and snow last week (Feb. 15-21), resulting in catastrophic power outages and frozen pipes along with optical sales dramatically decreasing in all categories in the region. Substantial optical sales declines in the South ranged from -27 index points for contact lenses to -31 index points for both frame units and lens pairs. Less substantial yet still significant decreases in optical sales were also experienced in all other census regions being tracked. Optical sales declines in the Northeast, also impacted by snowstorms over the course of last week, ranged from -8 index points for frame units and lens pairs to -10 index points for exams/refractions. Smaller optical sales declines in both the West and Midwest ranged from -1 index point for exams/refractions in the West to -7 index points for contact lenses in the West. During the same time period, all states (except Iowa ) also experienced decreases in the number of coronavirus cases, according to the Johns Hopkins Coronavirus Resource Center.
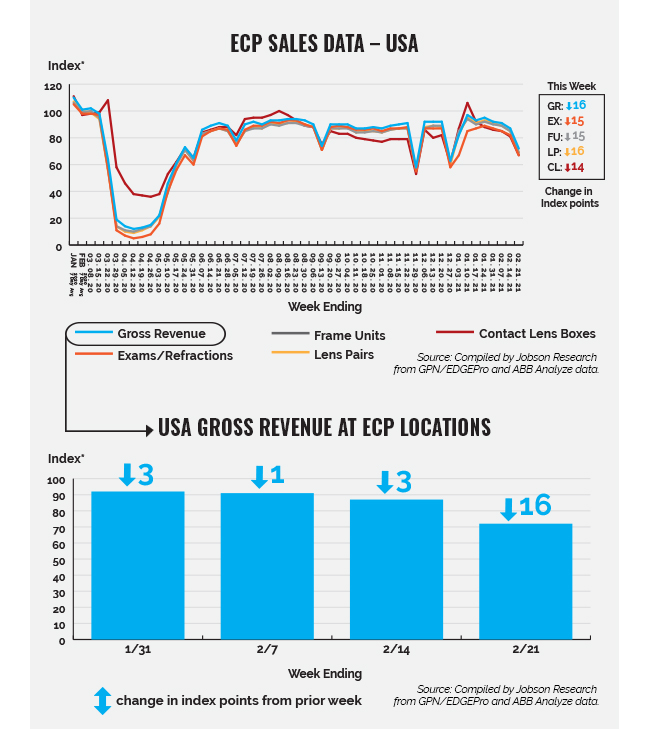
*The index baseline was developed by Jobson Research from total sales from an average seven days in the first quarter of 2019.This index baseline is equivalent to a score of 100. All other time periods going forward are calculated as a percent increase or decrease from the 100 baseline index of that period. This index is intended to show directional and magnitudinal change that the market is experiencing. Actual index scores are arbitrary meaning the baseline of 100 is simply used as a benchmark. Jobson Research shall not be held liable for any use or misuse of the data described and/or contained herein.
Please note that practices that use practice analytic systems tend to skew a bit larger and have higher revenue than practices that do not.
Source: GPN/EDGEPro and ABB Analyze contributed anonymous sales data used to determine gross revenue, exams/refractions, frame units, lens pairs, and contact lens boxes. Data was collected from approximately 3,500 independent eye care practices.
|