|
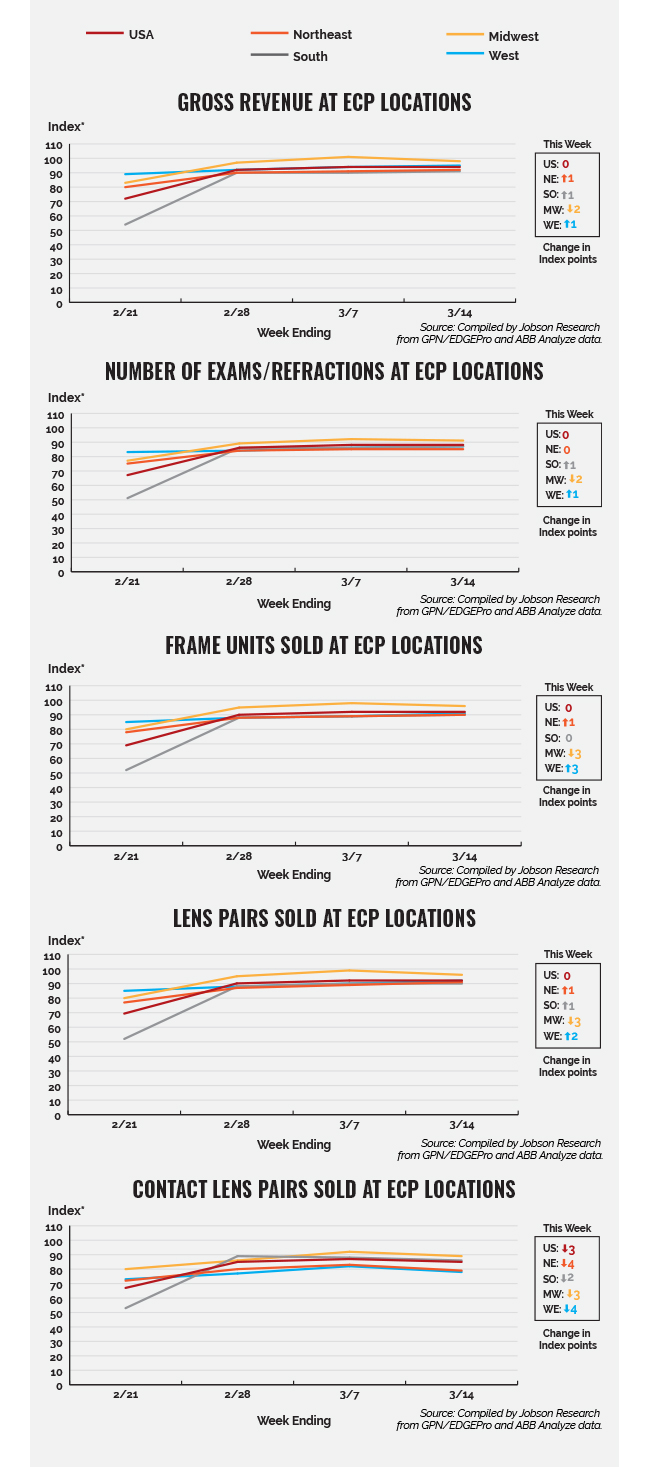
Regionally, the West showed the most growth in optical sales, ranging from 1 index point for gross revenue and exams/refractions to 3 index points for frame units. The Midwest experienced the largest declines in optical sales over the course of last week (March 8-14), ranging from -2 index points for gross revenue and exams/refractions to -3 index points for frame units, lens pairs, and contact lenses. The Northeast and South were either flat or close to flat, with any increases reaching only a negligible 1 index point. Contact lens sales were down in all regions, ranging from -2 index points in the South to -4 index points in the West and Northeast. This all coincides with a continuing variety of ups and downs in COVID cases within each state, according to the Johns Hopkins Coronavirus Resource Center.
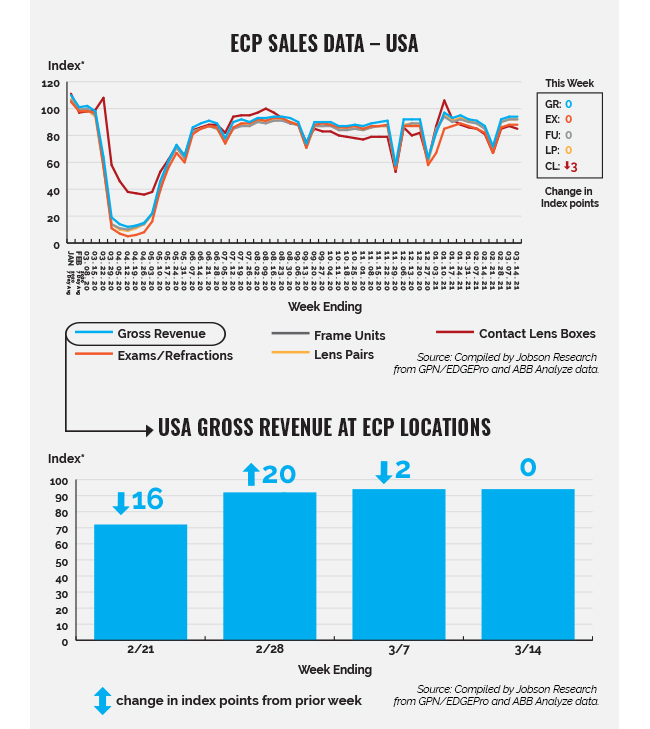
*The index baseline was developed by Jobson Research from total sales from an average seven days in the first quarter of 2019.This index baseline is equivalent to a score of 100. All other time periods going forward are calculated as a percent increase or decrease from the 100 baseline index of that period. This index is intended to show directional and magnitudinal change that the market is experiencing. Actual index scores are arbitrary meaning the baseline of 100 is simply used as a benchmark. Jobson Research shall not be held liable for any use or misuse of the data described and/or contained herein.
Please note that practices that use practice analytic systems tend to skew a bit larger and have higher revenue than practices that do not.
Source: GPN/EDGEPro and ABB Analyze contributed anonymous sales data used to determine gross revenue, exams/refractions, frame units, lens pairs, and contact lens boxes. Data was collected from approximately 3,500 independent eye care practices.
|