|
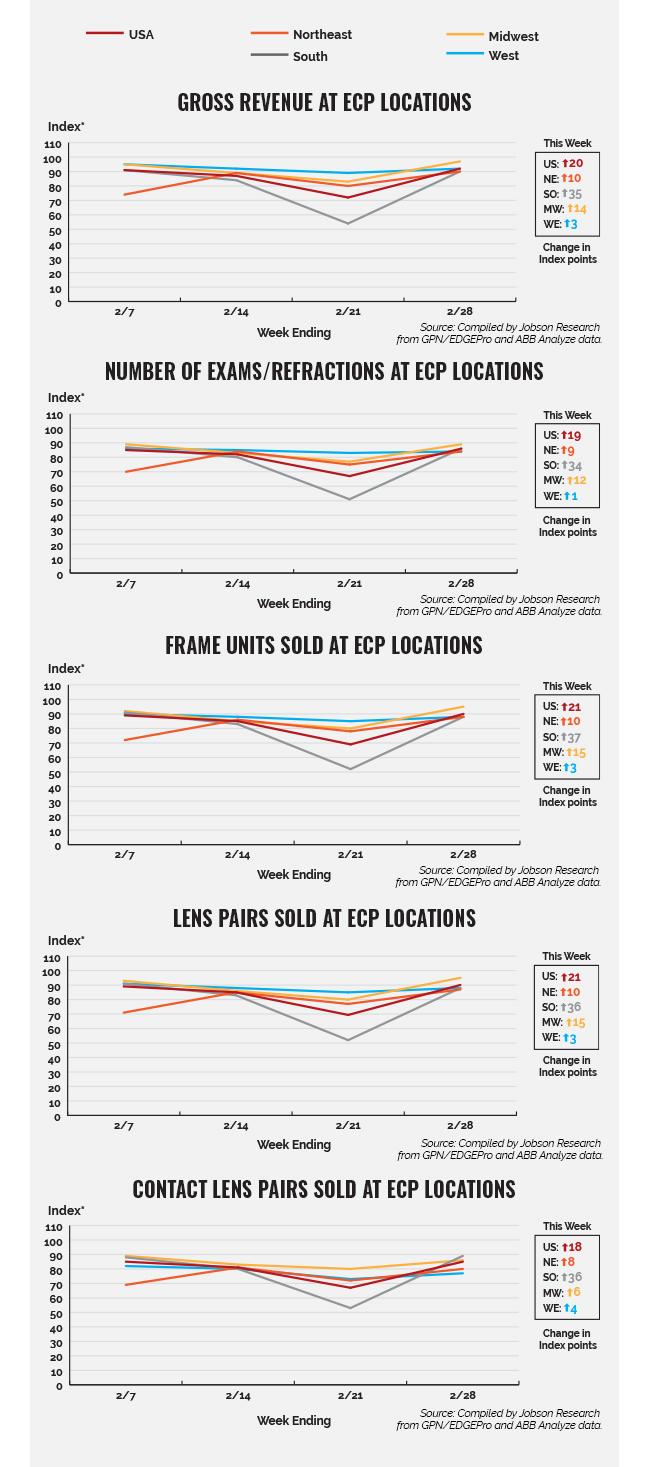
Over the course of last week (Feb. 22-28), all regional optical sales regained losses experienced during the past few weeks. While all regions easily regained the weather-related optical sales declines experienced the previous week (Feb. 15-21), some also surpassed those to return to even higher levels. Substantial increases in optical sales this past week were in the South (ranging from 34 index points for exams/refractions to 37 index points for frame units), which recovered from debilitating weather and resulting optical sales declines the previous week. Increases in optical sales were also experienced in all other service/product categories in all other census regions, ranging from a low of 1 index point for exams/refractions in the West to 15 index points for frame units and lens pairs in the Midwest. These differing degrees of optical sales recovery coincided with varying state-by-state increases and decreases in COVID cases, according to the Johns Hopkins Coronavirus Resource Center.
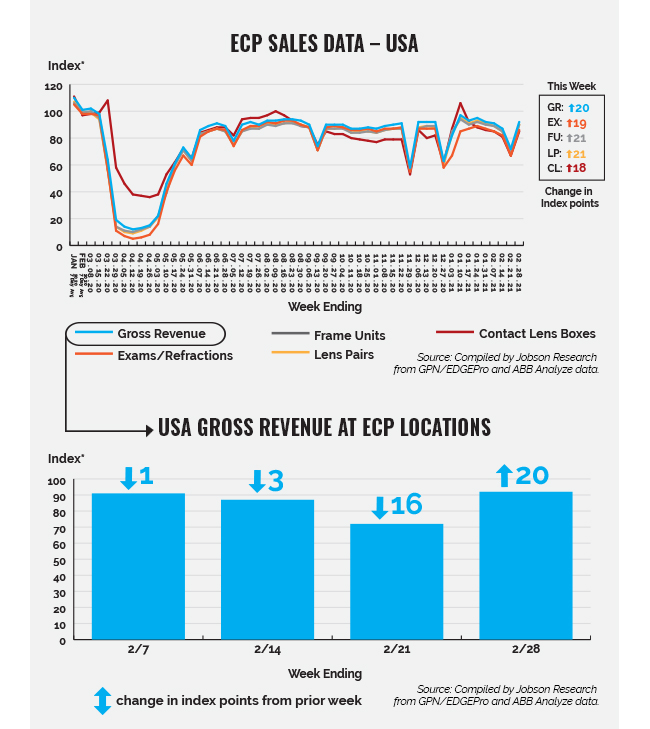
*The index baseline was developed by Jobson Research from total sales from an average seven days in the first quarter of 2019.This index baseline is equivalent to a score of 100. All other time periods going forward are calculated as a percent increase or decrease from the 100 baseline index of that period. This index is intended to show directional and magnitudinal change that the market is experiencing. Actual index scores are arbitrary meaning the baseline of 100 is simply used as a benchmark. Jobson Research shall not be held liable for any use or misuse of the data described and/or contained herein.
Please note that practices that use practice analytic systems tend to skew a bit larger and have higher revenue than practices that do not.
Source: GPN/EDGEPro and ABB Analyze contributed anonymous sales data used to determine gross revenue, exams/refractions, frame units, lens pairs, and contact lens boxes. Data was collected from approximately 3,500 independent eye care practices.
|