|
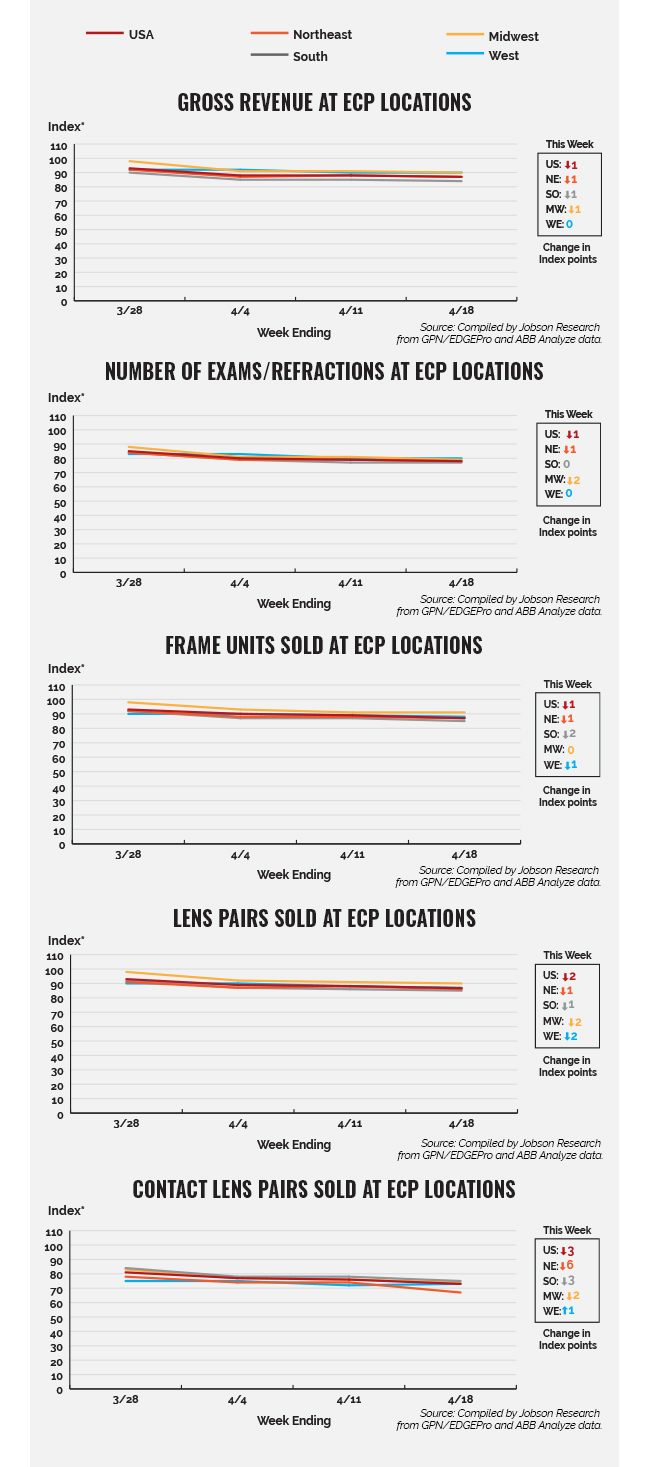
Optical sales in all regions and in most categories (except contact lenses) were either flat or down slightly at rates of only -1 or -2 index points. Categories and regions with the higher -2 index point rate of declining optical sales were exams/refractions in the Midwest, frame units in the South, and lens pairs in the Midwest and West. Contact lens sales (which often follow their own direction) had their best performance in the West, increasing by 1 index point, and their worst in the Northeast, decreasing by -6 index points. This coincides with COVID-19 cases increasing in some areas of the country, with the upper Midwest hit especially hard, according to the Johns Hopkins Coronavirus Resource Center.
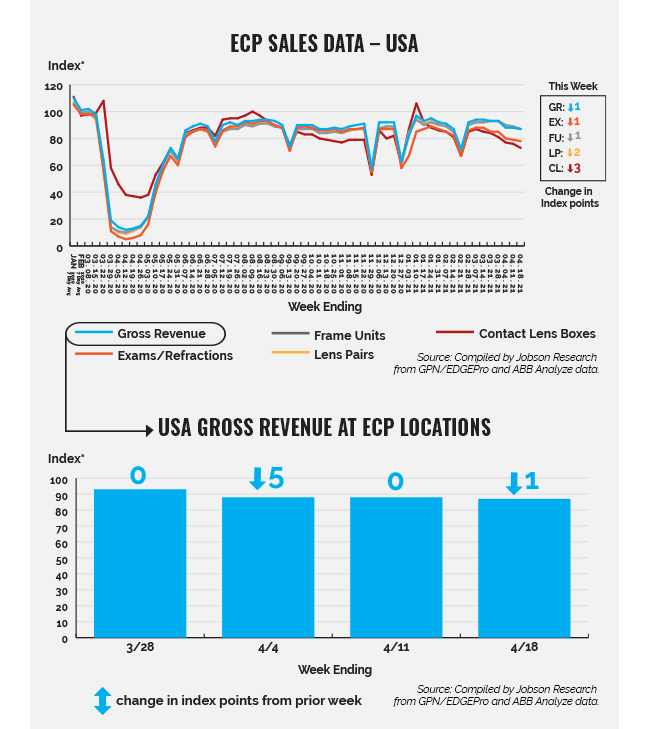
*The index baseline was developed by Jobson Research from total sales from an average seven days in the first quarter of 2019.This index baseline is equivalent to a score of 100. All other time periods going forward are calculated as a percent increase or decrease from the 100 baseline index of that period. This index is intended to show directional and magnitudinal change that the market is experiencing. Actual index scores are arbitrary meaning the baseline of 100 is simply used as a benchmark. Jobson Research shall not be held liable for any use or misuse of the data described and/or contained herein.
Please note that practices that use practice analytic systems tend to skew a bit larger and have higher revenue than practices that do not.
Source: GPN/EDGEPro and ABB Analyze contributed anonymous sales data used to determine gross revenue, exams/refractions, frame units, lens pairs, and contact lens boxes. Data was collected from approximately 3,500 independent eye care practices.
|