|
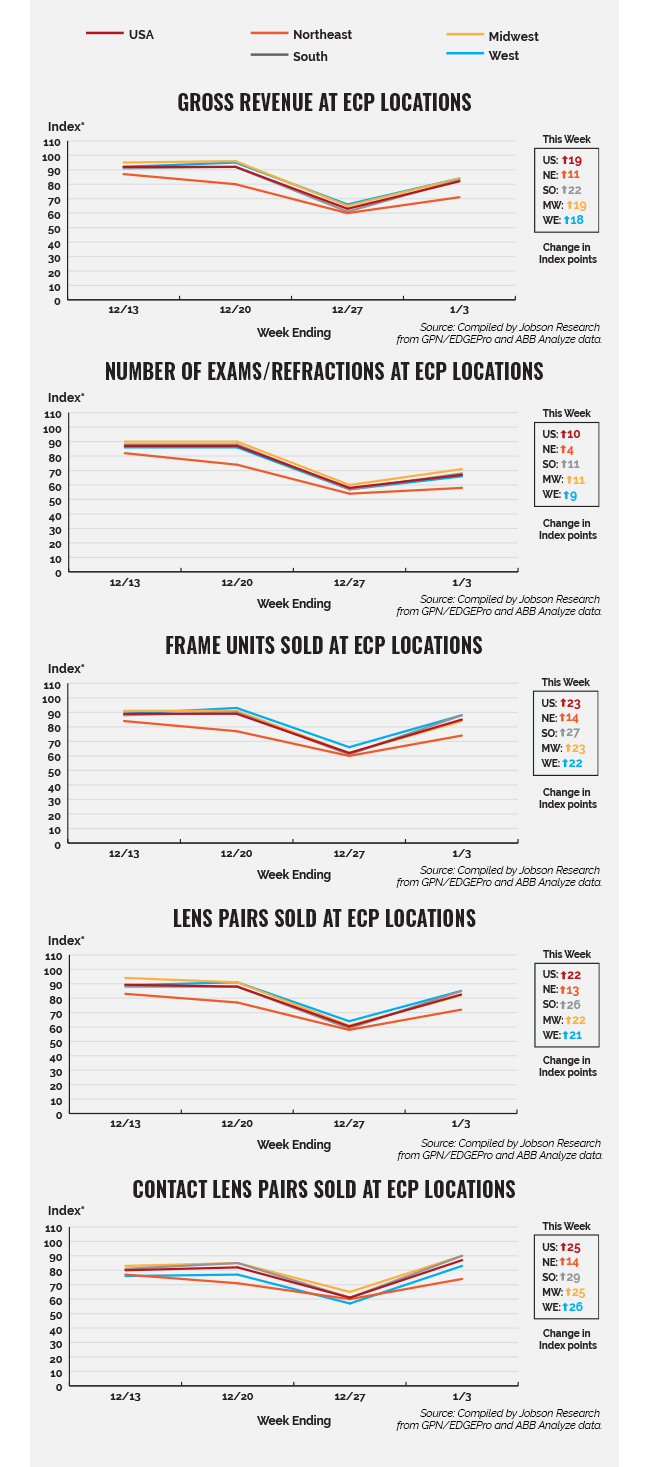
Regionally, all regions and categories bounced back. While the South, Midwest, and West all experienced strong resurgence in all categories, albeit to sales rates higher than pre-Christmas levels only for contact lenses, the Northeast’s resurgence lagged behind the three other census regions. With COVID-19 cases on the increase throughout much of the country, according to Johns Hopkins Coronavirus Resource Center, the correlation with regional optical sales is mixed.
*The index baseline was developed by Jobson Research from total sales from an average seven days in the first quarter of 2019.This index baseline is equivalent to a score of 100. All other time periods going forward are calculated as a percent increase or decrease from the 100 baseline index of that period. This index is intended to show directional and magnitudinal change that the market is experiencing. Actual index scores are arbitrary meaning the baseline of 100 is simply used as a benchmark. Jobson Research shall not be held liable for any use or misuse of the data described and/or contained herein.
Please note that practices that use practice analytic systems tend to skew a bit larger and have higher revenue than practices that do not.
Source: GPN/EDGEPro and ABB Analyze contributed anonymous sales data used to determine gross revenue, exams/refractions, frame units, lens pairs, and contact lens boxes. Data was collected from approximately 3,500 independent eye care practices.
|