-

Jobson Optical Research
is tracking national and regional optical business metrics for the U.S.

*This index baseline was developed by Jobson Research from total sales from an average week in 2019.

This tracker measures sales trends comparing pre-pandemic, during the pandemic, and post-pandemic.

We selected 1,500 optical locations that have been operating and reporting their sales to our partners, GPN and ABB Analytics, since 2019. We re-based the index to an average week in 2019. This new index base will be used as an arbitrary benchmark and assigned a value of 100.

GROSS REVENUE 3-YEAR TREND

The national average for gross revenue at ECP locations remained unchanged when comparing last week (Aug. 23-29) with the previous week (Aug. 16-22). This brings gross revenue to a level slightly above where it was at this point in time (Week 35) in 2019 but slightly below where it was at this time last year.

-

BUSINESS METRICS

All optical sales categories were either flat or down slightly when comparing last week with the previous week. Gross revenue, frame units, and lens pairs all remained unchanged, while exams/refractions were down -2 index points, and contact lens sales were down -4 index points.

SNAPSHOT

Contact lens sales fell further below those of an average week in 2019 while all other optical sales categories showed little to no change in relation to an average week in 2019, the index baseline assigned a value of 100 for this Optical Business Tracker. That leaves gross revenue slightly above an average week in 2019 and the other four categories slightly below.

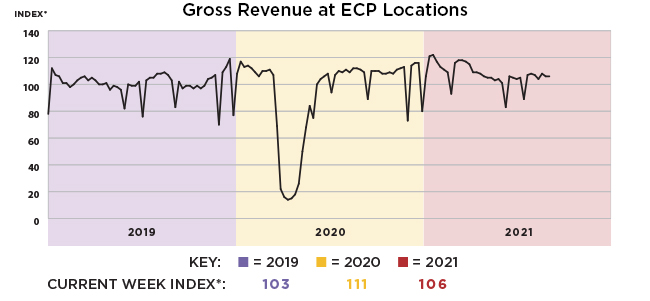
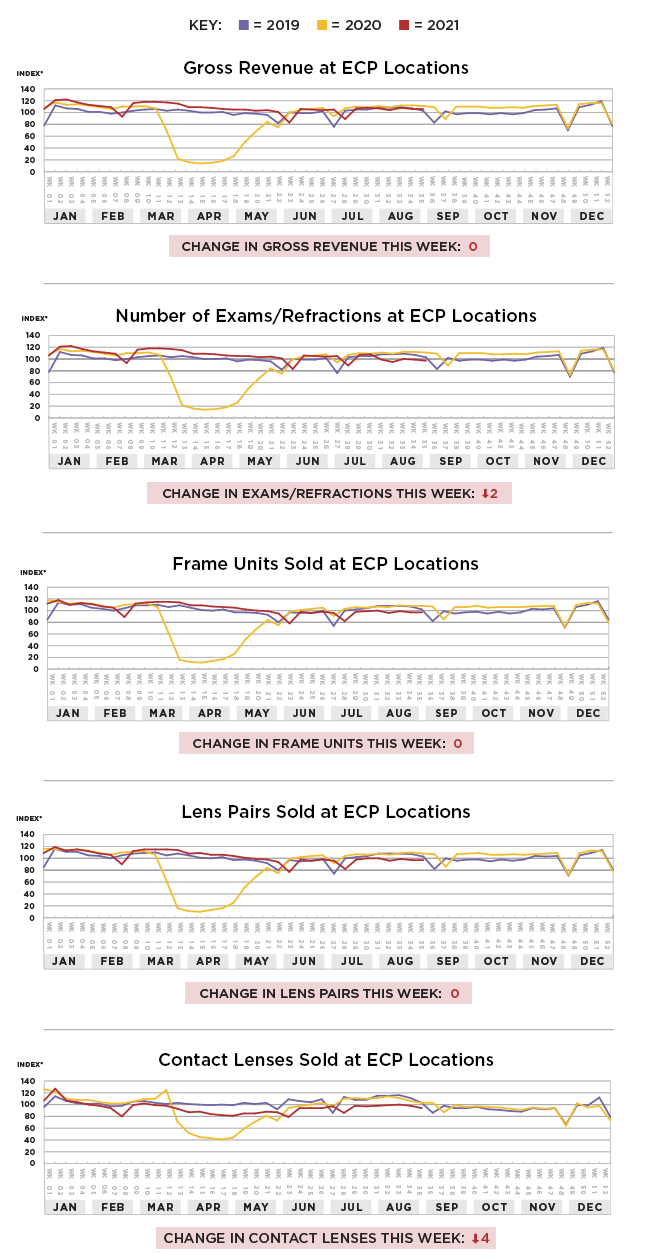
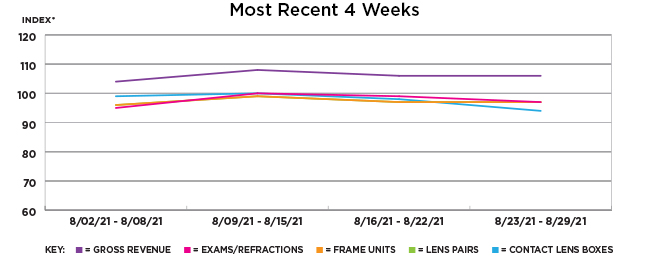
*The index baseline was developed by Jobson Research from total sales from an average week in 2019. This index baseline is equivalent to a score of 100. All other time periods going forward are calculated as a percent increase or decrease from the 100 baseline index of that period. This index is intended to show directional and magnitudinal change that the market is experiencing. Actual index scores are arbitrary meaning the baseline of 100 is simply used as a benchmark. Jobson Research shall not be held liable for any use or misuse of the data described and/or contained herein.

Please note that practices that use practice analytic systems tend to skew a bit larger and have higher revenue than practices that do not.

Source: GPN/EDGEPro and ABB Analyze contributed anonymous sales data used to determine gross revenue, exams/refractions, frame units, lens pairs, and contact lens boxes. Data was collected from approximately 1,500 independent eye care practices.

For more information from Jobson Research contact jwaller@jobson.com,

you may also reach out to GPN/EDGEPro and ABB Analyze directly.

-