-

April 2026

Jobson Optical Research is tracking national optical business metrics for the U.S.

*This index baseline was developed by Jobson Research from total sales from an average month in 2019.

GROSS REVENUE TREND

The national average for gross revenue at ECP locations decreased last month (April 2026) when compared with the previous month at a rate of -7 index points. That places gross revenue at a level -1 index point below where it was at this point in time (April) when compared with last year (2025), 8 points above the same period in 2024, 26 points above 2023, 29 points above 2022, 30 points above 2021, 132 points above 2020 (during the onset of the COVID 19 Pandemic), and 50 points above 2019.

-

-

BUSINESS METRICS

Following the decrease in gross revenue, all other optical sales categories also decreased last month when compared with the previous month, at a rate of -6 index points for exams/refractions, frame units, and lens pairs. Contact lenses decreased at rate of -7 index points. When comparing last month’s optical sales with the same period last year, all of the other categories decreased as well at a rate of -6 index points for exams/refractions, frame units, and contact lenses. Lens pairs decreased at a rate of -7 index points.

SNAPSHOT

With all optical sales categories decreasing last month, all categories still reached a level above an average month in 2019 (the index baseline assigned a value of 100 for this Optical Business Tracker). These ranged from a high of 150 index points for gross revenue to a low of 102 index points for contact lenses. The other categories reached 118 index points for exams/refractions, 116 index points for frame units, and 122 index points for lens pairs.

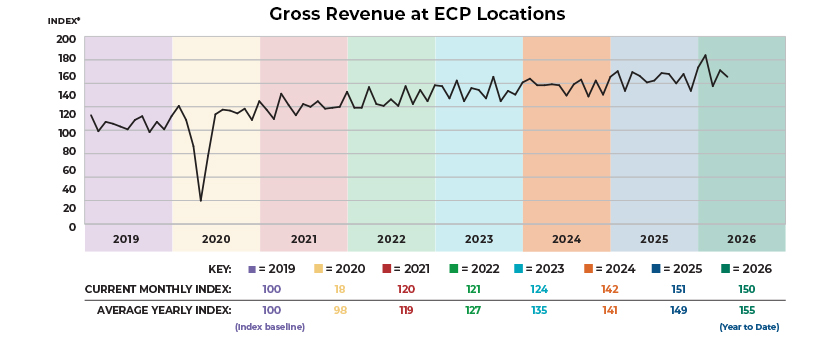
We selected 1,500 optical locations that have been operating and reporting their sales to our partners, GPN and ABB Analyze, since 2019. We based the index on an average month in 2019 and assigned an arbitrary benchmark baseline value of 100. All monthly index data points are calculated as a percentage increase or decrease from the baseline index value. This index is intended to show directional and magnitudinal change that the market is experiencing.


Jobson Research shall not be held liable for any use or misuse of the data described and/or contained herein. Please note that practices that use practice analytic systems tend to skew a bit larger and have higher revenue than practices that do not.

Source: GPN/EDGEPro and ABB Analyze contributed anonymous sales data used to determine gross revenue, exams/refractions, frame units, lens pairs, and contact lens boxes. Data was collected from approximately 1,500 independent eye care practices.

For more information from Jobson Research contact deydlin@jobson.com,

you may also reach out to GPN/EDGEPro and ABB Analyze directly.

-