-

Jobson Optical Research
is tracking national and regional optical business metrics for the U.S.

*This index baseline was developed by Jobson Research from total sales from an average week in 2019.

This Tracker Got A Make-Over!

When we launched this tracker, our goal was to monitor the optical industry through the pandemic. While the road ahead is still unknown, it appears we, as a nation, are moving forward.

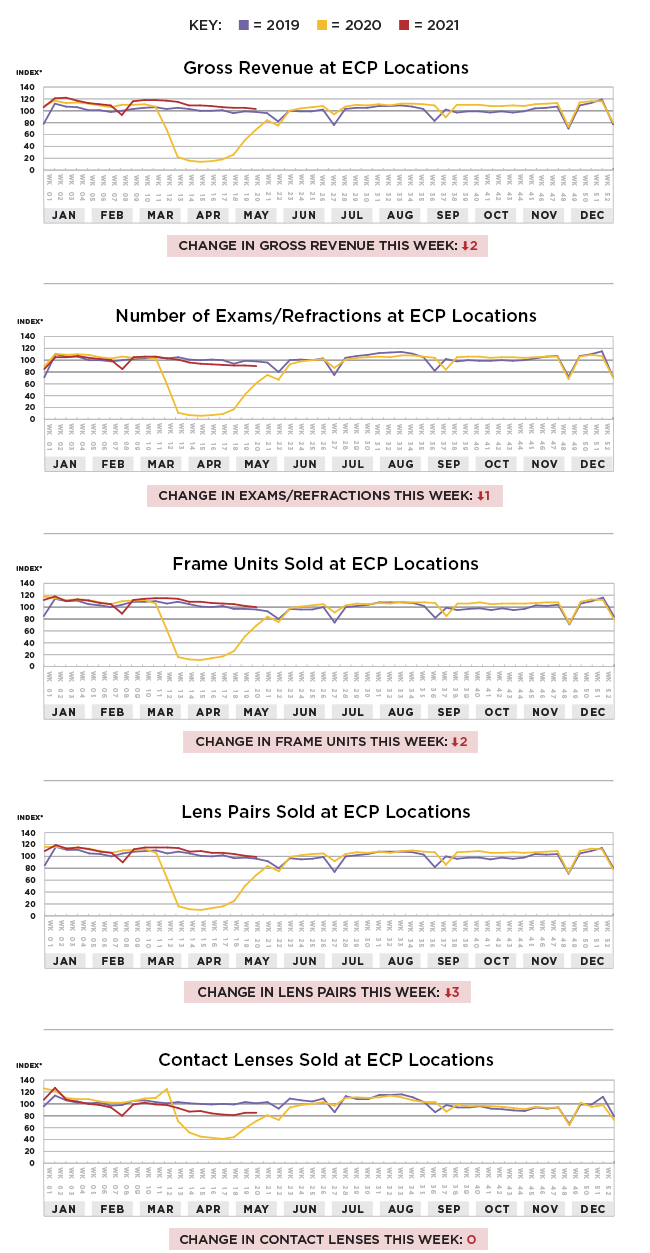
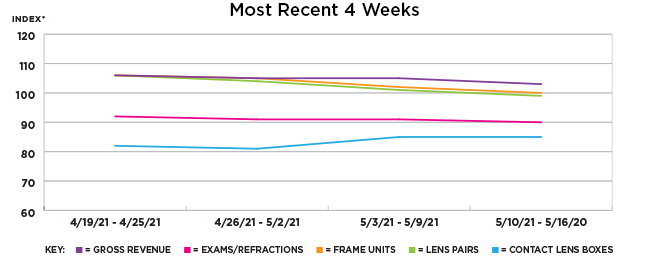
Now, the tracker compares more than just week to week. The tracker now measures sales trends comparing pre-pandemic, during the pandemic, and post-pandemic.

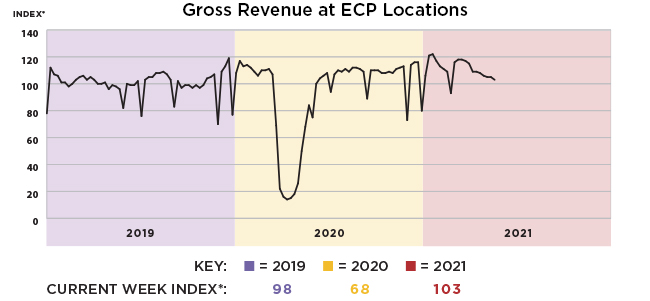
We selected 1,500 optical locations that have been operating and reporting their sales to our partners, GPN and ABB Analytics, since 2019. We re-based the index to an average week in 2019. This new index base will be used as an arbitrary benchmark and assigned a value of 100.

GROSS REVENUE 3-YEAR TREND

When comparing optical sales during the 20th week of 2021 (May 10-16) with the same time period in 2020, gross revenue reported by ECP locations this year shows substantial improvement over last year when we were in the midst of pandemic shutdowns. Gross revenue for the 20th week of 2021 also reached a higher level than that generated by optical sales during the same time period two years ago in 2019.

-

BUSINESS METRICS

Over the course of last week (May 10-16), optical sales in all five business metrics categories being tracked continued the declines that they have been experiencing for over one month. When comparing last week’s optical sales with those of the previous week, changes in the index rate range from flat for contact lens sales to -3 index points for lens pairs.

SNAPSHOT

For the past four weeks, optical sales have been decreasing (except contact lenses). Since the beginning of the last four-week period, declines in optical sales ranged from only -2 index points for exams/refractions to -7 index points for lens pairs. Contact lenses, which often trend in inverse proportion to all other categories, increased in sales by 3 index points over the past four weeks, yet they remain at the lowest index level among all four categories being tracked.

*The index baseline was developed by Jobson Research from total sales from an average week in 2019. This index baseline is equivalent to a score of 100. All other time periods going forward are calculated as a percent increase or decrease from the 100 baseline index of that period. This index is intended to show directional and magnitudinal change that the market is experiencing. Actual index scores are arbitrary meaning the baseline of 100 is simply used as a benchmark. Jobson Research shall not be held liable for any use or misuse of the data described and/or contained herein.

Please note that practices that use practice analytic systems tend to skew a bit larger and have higher revenue than practices that do not.

Source: GPN/EDGEPro and ABB Analyze contributed anonymous sales data used to determine gross revenue, exams/refractions, frame units, lens pairs, and contact lens boxes. Data was collected from approximately 1,500 independent eye care practices.

For more information from Jobson Research contact jwaller@jobson.com,

you may also reach out to GPN/EDGEPro and ABB Analyze directly.

-