|
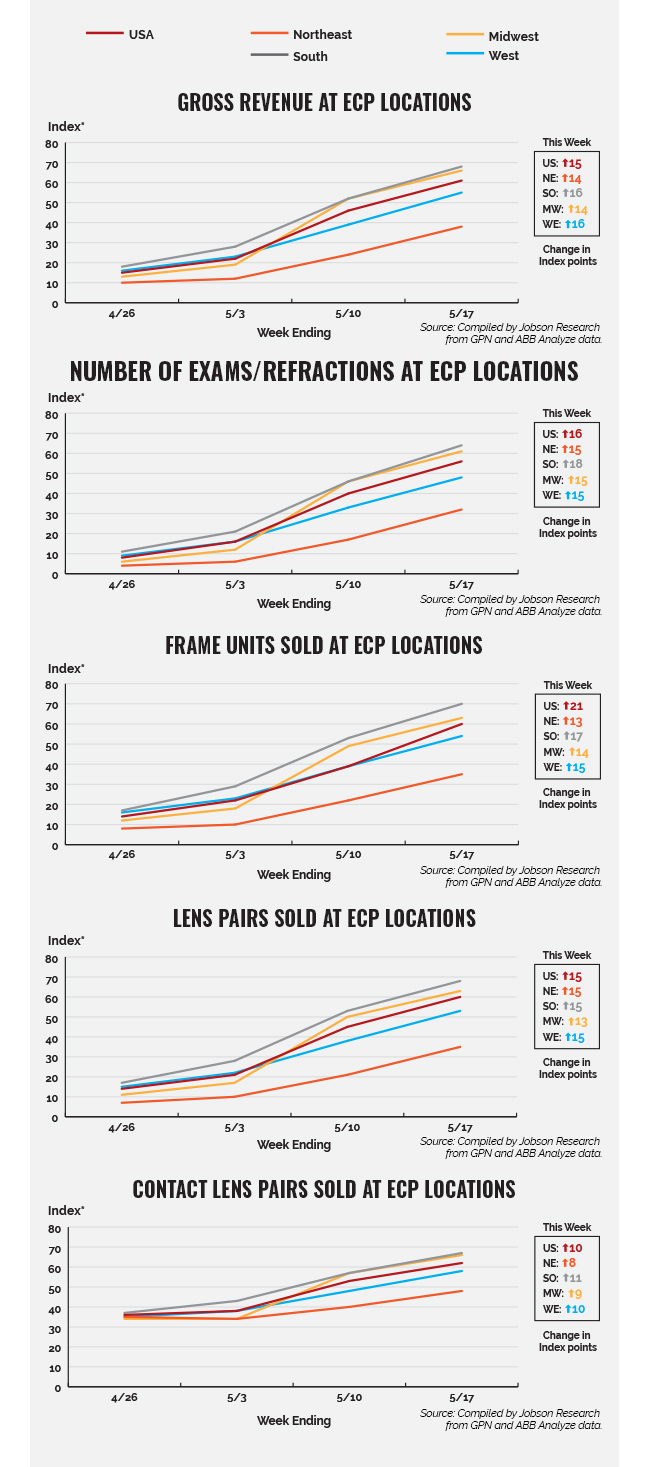
Regionally, every product category in every region showed improvement. Most growth was consistent across the board at index rates in the mid-teens for all products in all regions. Contact lenses again followed their own path as they have since monitoring these metrics began, also increasing in sales but at a slightly lower rate hovering around 10 index points and as low as 8 index points in the Northeast.
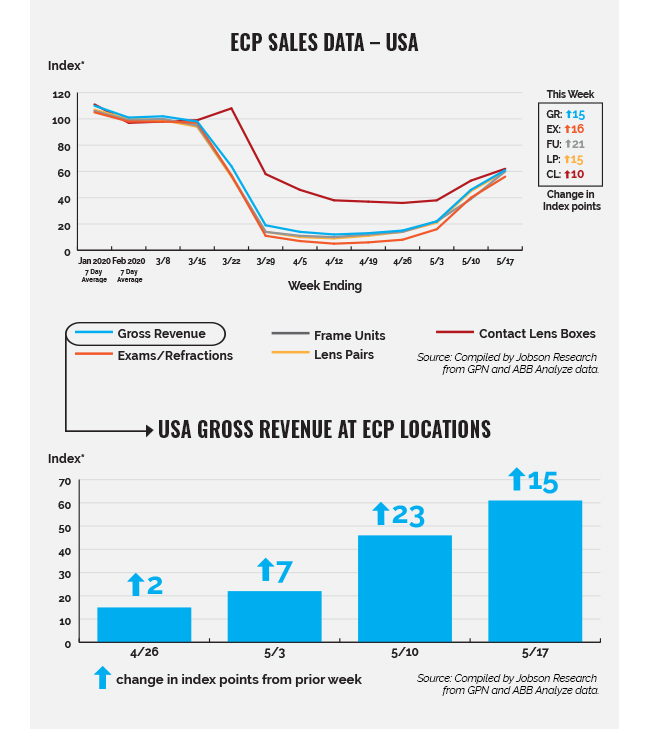
* The index baseline was developed by Jobson Research from total sales from an average seven days in the first quarter of 2019. This index baseline is equivalent to a score of 100. All other time periods going forward are calculated as a percent increase or decrease from the 100 baseline index of that period. This index is intended to show directional and magnitudinal change that the market is experiencing. Actual index scores are arbitrary meaning the baseline of 100 is simply used as a benchmark. Jobson Research shall not be held liable for any use or misuse of the data described and/or contained herein.
Source: GPN and ABB Analyze contributed anonymous sales data used to determine gross revenue, exams/refractions, frame units, lens pairs, and contact lens boxes. Data was collected from approximately 3,500 independent eye care practices.
|